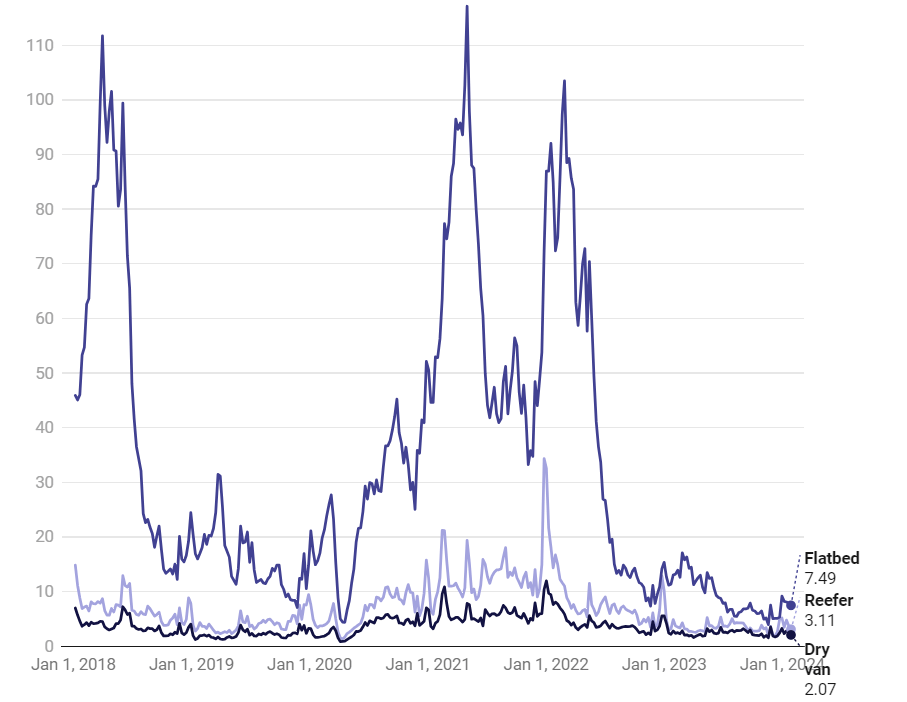
The trucking industry in the United States is a dynamic sector, influenced by a variety of factors including economic conditions, consumer demand, seasonal changes, and unexpected events like natural disasters. This blog post delves into the latest trends and data in the trucking industry, highlighting key aspects such as Class 8 truck orders, trailer orders, tonnage, and rates for various types of hauls. Stay tuned for regular updates with the most recent data.

Load-to-truck ratios, as reported by DAT Freight & Analytics, are critical indicators of the balance between supply and demand in the spot freight market. These ratios are derived by comparing the number of loads available to the number of trucks available on the DAT One load board. Shifts in these ratios often predict changes in spot market rates. Recent data indicates a decrease in load-to-truck ratios across various equipment types in the last week of January compared to the week before. For instance, dry van ratios fell from 2.6 to 2.1 loads per truck, while reefer ratios dropped from 3.7 to 3.1, and flatbed ratios went down from 7.9 to 7.5 loads per truck.

Linehaul rates, which are a seven-day moving average of spot rates for dry van, reefer, and flatbed hauls, serve as a gauge for the equilibrium between supply and demand in the spot market. These rates, sourced from DAT’s RateView database, exclude fuel surcharges. Recent trends show a decline in national average rates for different types of equipment. For instance, dry van rates decreased by around 4 cents to $1.70, reefer rates fell by about 7 cents to $2.03, and flatbed rates slightly reduced by approximately a penny to $1.97. This trend reversal in spot rates, particularly after a spike caused by extreme weather conditions, reflects the dynamic nature of the trucking market.

Class 8 truck orders are a key indicator of market confidence and future industry growth. The latest data shows a year-over-year increase in preliminary Class 8 net orders, rising from 21,600 units in 2022 to 26,400 units in 2023, as reported by FTR. This trend suggests a continued willingness among fleets to invest in new equipment despite prevailing uncertainties in the freight market.

The American Trucking Associations (ATA) has been monitoring trucking tonnage for decades, offering insights into the movement of freight through contracts as opposed to spot market transactions. The ATA Truck Tonnage Index, where a baseline of 100 represents conditions in 2015, saw a 2.1% increase in December, reaching 115.7. However, despite this uptick, the tonnage showed a year-over-year contraction, indicating a continued recessionary trend in the industry.

The Cass Truckload Linehaul Index, which includes both spot and contract freight and has a baseline of 100 set in 2005, offers a broader perspective on rate fluctuations influenced by supply, demand, fuel prices, and insurance costs. In December, the index saw a marginal increase of 0.4% to 141.3, marking the smallest year-over-year decline in 10 months. This data provides valuable insights into the current state and future direction of the trucking market.