As we move through 2024, the trucking industry is experiencing significant shifts in rates, capacity, and demand. Truckload markets have seen steady demand growth, but excess capacity remains a challenge for many carriers.
In this blog post, we’ll explore how the state of trucking rates, capacity trends, and market demand is shaping the industry in 2024, using real data from the FreightWaves Q3 2024 Carrier Rate Report.
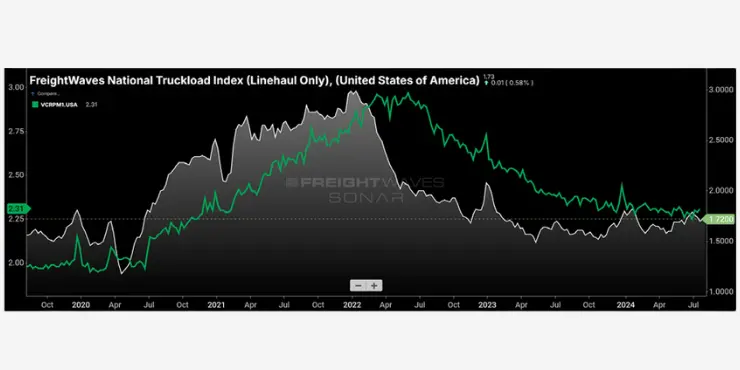
Capacity has been one of the biggest drivers of change in the trucking industry for several years. Despite strong volumes in the second quarter of 2024, excess capacity continued to weigh on carrier rates. However, this trend is unlikely to persist much longer. Recent data from the report suggests that spot rates could rise between 2.5% and 6% in Q3 2024.
The National Truckload Index (NTI) shows that while rates fell by 2.2% in Q2, they ended the quarter at their highest level since early February. The report predicts a notable bump in dry van spot rates in Q3, driven by capacity exits as emergency loan repayments resume. This projected rate increase is primarily driven by a quiet but consistent exit of capacity from the market. As emergency loan repayments come due, we anticipate more small carriers leaving the market, potentially sparking a capacity crunch that will further drive up spot rates.
Since the pandemic, an overabundance of cheap government credit has allowed many small carriers to operate with minimal or negative margins. But as the industry moves forward in 2024, the effects of this excess capacity are starting to fade. The FreightWaves report highlights that trucking capacity is gradually tightening as small carriers struggle with rising costs and delinquent loans.
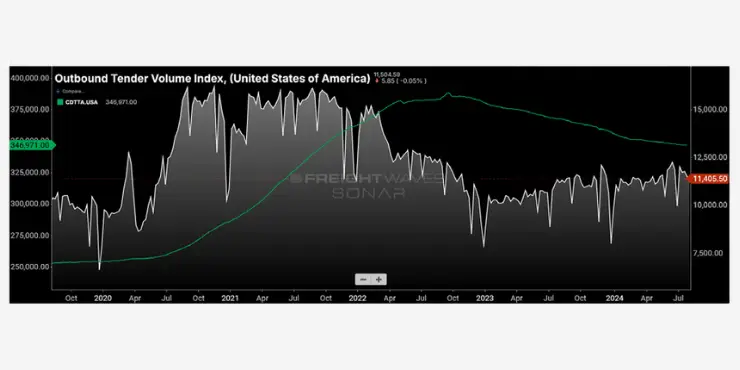
This figure illustrates the disconnect between the growth in total trucking authorities and the actual volume of freight being moved. Despite an increase in trucking authorities, many small operators are exiting the market due to financial pressures. This trend will likely lead to tighter capacity and higher rates in the second half of 2024.
Tender rejection rates, which measure the percentage of shipments that carriers reject in favor of more lucrative spot market loads, reached their highest levels since August 2022 by the end of Q2. This suggests that carriers are becoming more selective about the freight they haul, further contributing to rising rates.
Demand for trucking services showed remarkable strength in Q2 2024, particularly in April and June, though May experienced some softness. Seasonal events like Amazon’s Prime Day and Target’s Circle Week gave a significant boost to truckload volumes towards the end of the quarter. The trucking industry also benefited from an early maritime freight peak season, driven by labor uncertainty at East and Gulf Coast ports.
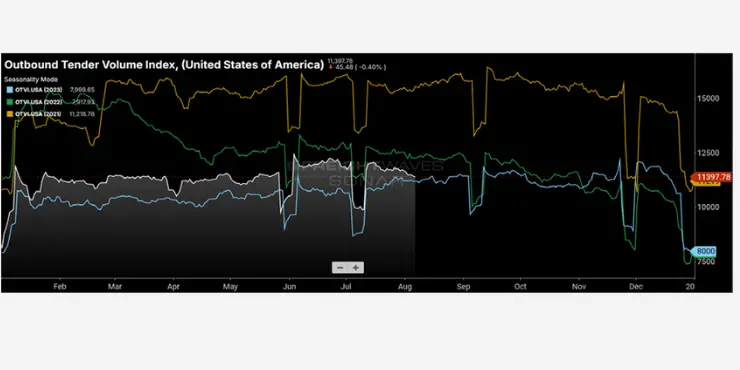
The chart shows the year-to-date 2024 National Outbound Tender Volume Index (OTVI), compared with previous years. Despite a dip in May, tender volumes in 2024 have outpaced previous years, supported by strong consumer demand and strategic shifts in maritime freight. The outlook for Q3 2024 remains positive, with freight markets expected to benefit from back-to-school shopping and early holiday season demand. However, there are still some economic headwinds to watch for, particularly if consumer spending slows in response to rising debt levels and inflationary pressures.
The broader economy is creating uncertainty for the trucking industry. Retail sales fell both on a yearly and monthly basis in June, and labor market figures have been consistently revised lower throughout Q2 2024. Household debt levels are rising, with revolving credit (including credit card debt) increasing by 6.3% in May. This spike in debt, coupled with the high cost of credit, could dampen consumer spending, potentially affecting freight demand in the second half of the year.
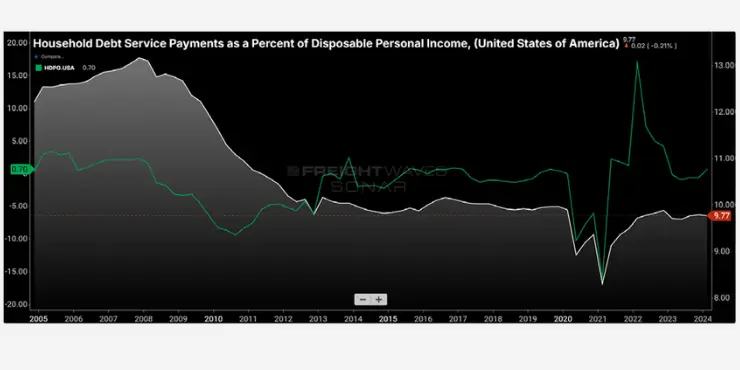
This figure highlights the growing burden of household debt as a percentage of disposable income. With credit card interest rates near all-time highs, consumers may soon begin to pull back on spending, which could impact freight volumes in the coming months. Despite these challenges, carriers remain cautiously optimistic. According to the FreightWaves Carrier Survey, 42% of respondents expect freight volumes to rise slightly in Q3 2024, while 46% predict that linehaul rates will remain stable. Additionally, the majority of carriers anticipate little to no change in diesel prices, which could help mitigate rising operational costs.
Capacity trends in 2024 are being shaped by a combination of economic pressures and strategic decision-making by carriers. In a recent survey, 37% of carriers reported maintaining their fleet size over the past 12 months, while 32% increased their fleet size by 1% to 20%. However, many small carriers are still struggling with fleet costs, particularly as new truck orders have slowed.
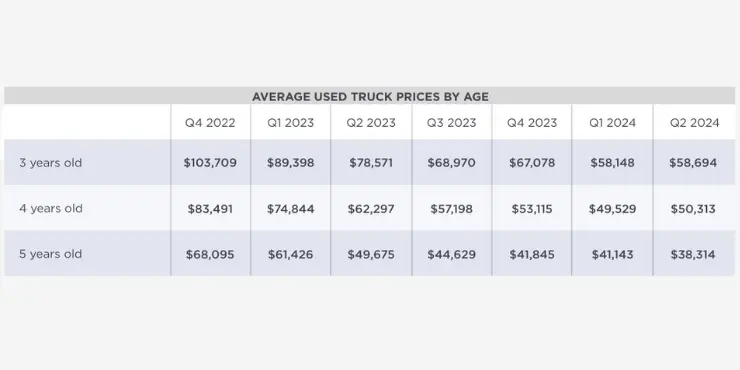
The chart shows a decline in used truck prices over the past seven quarters, which is a sign that carriers are facing financial difficulties in maintaining and replacing their aging fleets. With rising maintenance costs and declining margins, many carriers are being forced to make tough decisions about fleet management.
Looking ahead, 51% of carriers plan to grow their fleets in the next 12 months, driven by optimism that the Federal Reserve may begin cutting interest rates. This could unlock pent-up demand for both new and used trucks, providing some relief to carriers struggling with high capital costs.
The trucking industry in 2024 is facing a period of transformation. With rising rates, tightening capacity, and shifting demand, both carriers and shippers must stay vigilant and adaptable to thrive. While economic headwinds may create challenges, there are also opportunities for growth as the market recalibrates.
By staying informed about capacity trends, rate changes, and demand fluctuations, industry players can position themselves for success in a rapidly evolving landscape.